 Well, that is the million-dollar question… ‘cause if you find the right area for your strategy, it could become your little gold mine of profit making investments.
But…
You Still Need To BEWARE!
Why? Because not all data is made equal… let me explain.
When looking to invest in my next property deal, I look at data to give me an insight into what is happening in an area. By understanding what is happening, it helps me understand whether my potential investment will be protected or whether it is a no-go zone.
For example, here are a few questions I need answers to:
The reason for the obvious questions is this…
I want to minimise my risk by knowing if people are moving in or away from an area and the data will tell me if I can:
a) rent my property easily and
b) sell it easily when it comes time to offload it at a profit.
 I don’t want to get stuck with an investment property that won’t rent 365 days of the year or have low vacancies, nor do I want to have my investment sit on the market for months and months because there is no demand for the property due to declining population.
To get the answers to these questions, I always look at the data reports from different sources and the good news is that the latest Census Data was released in June 2017, which is helpful.
Not All Data Is Created Equal
In doing the research for this article, I used the latest Census Data where I discovered something very disturbing that you need to know.
Now, everyone (including myself) says to use data to help with your investment choices, but…
What if the data is wrong?
What if the data is a moving target?
How is it that the data from various sources is always different and never marry up with each?
Well, in looking at the Census data specifically, I found some discrepancies.
I am not recommending these areas, only using them as an example so that you can keep it in mind when doing your own research on finding an area.
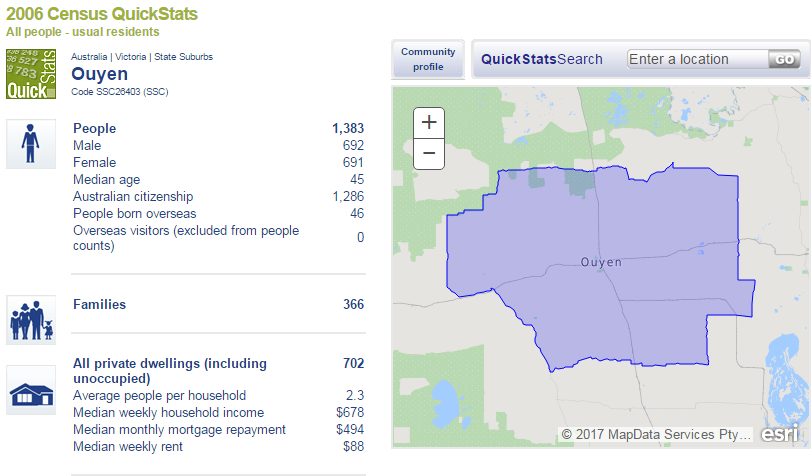
Let’s look at the population for the Ouyen LGA area in Victoria and what the ‘just released’ Census data had to say about it.
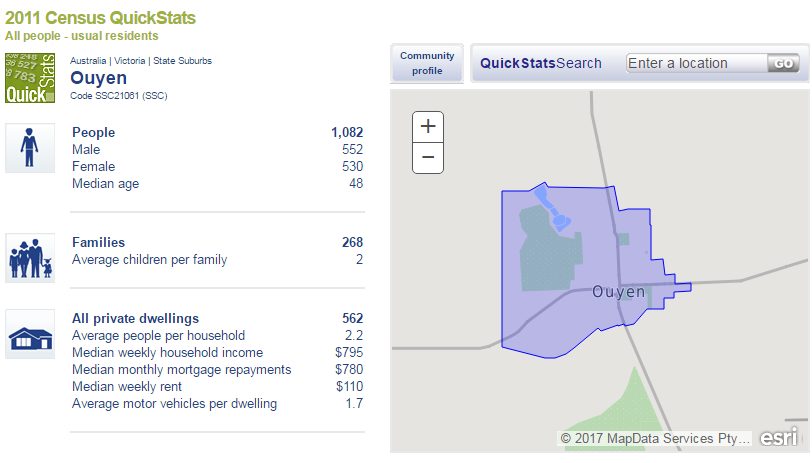
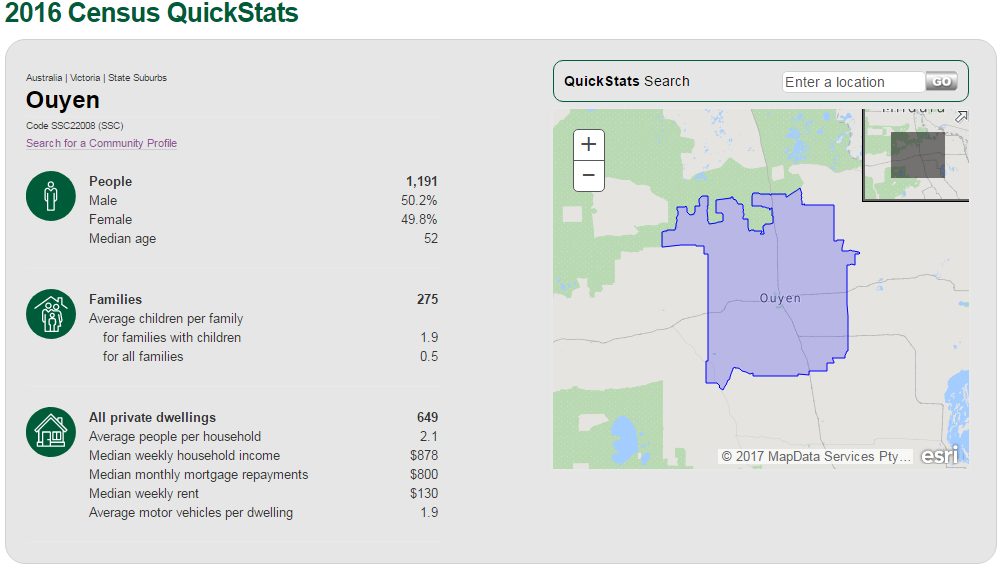
What I discovered was that from the 2006 Census, the population for the area was 1383, in the 2011 Census the population was 1082 and then in the 2016 Census the population was 1191.
Now I can hear you say; what is happening in the area that the population has dropped by 301 from 2006 to 2011? This too, me scratching my head until I dug a bit deeper.
What you will see in the following snapshots from the Australian Bureau of Statistics (ABS) website is that the boundary for the area has changed and therefore explaining why the numbers are different.
Big Mistake…
So unless you know to look deeper and compare the data, it obviously makes it very difficult for an investor to get a true picture of whether the population has grown or is on the decline. At first glance you could interpret the data and assume the population has grown.
Extreme research required
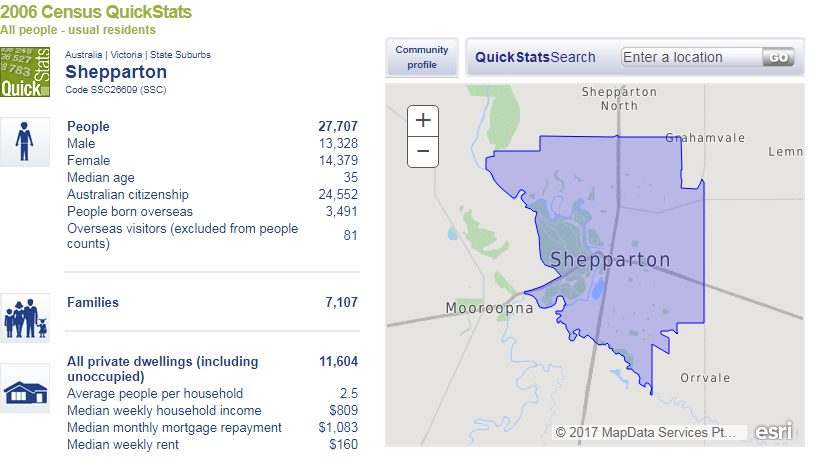
As a result of this anomaly, I continued to dig deeper and investigate another area to see if the same concern was happening.
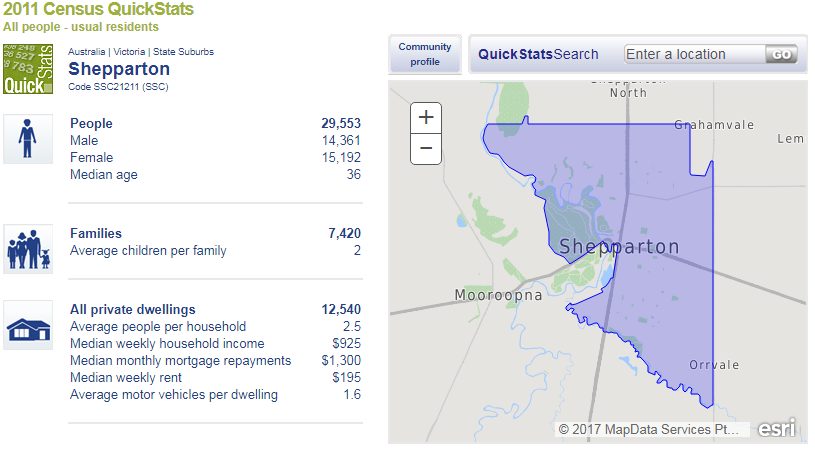
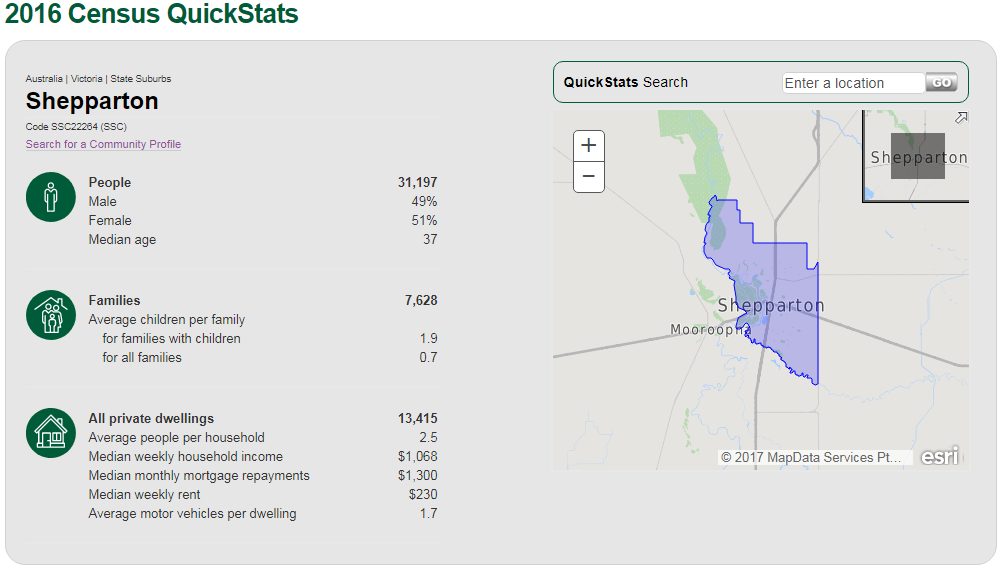
As you can see from the snapshots below, the boundaries for Shepparton in Victoria have also changed, although in this example the population has steadily increased from 2006 to 2016 along with the dwelling numbers.
Also, please note… that in both instances I was able to gather this information using the same State Suburb (SSC) heading from the ABS website.
Let’s Dig Deeper into the Research
OMG… this is turning into a wild goose chase!
Just to double-check that there is consistency with the data, I decided to investigate another area further afield and went to Bathurst in New South Wales.
Take a look at these 3 snapshots:
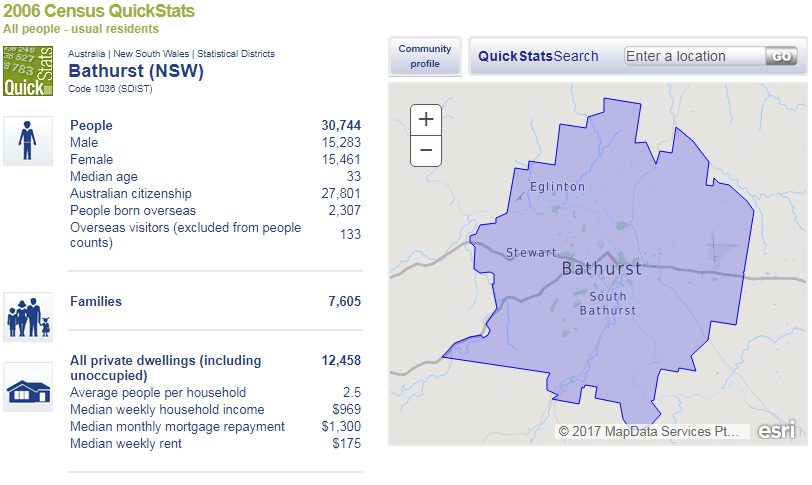
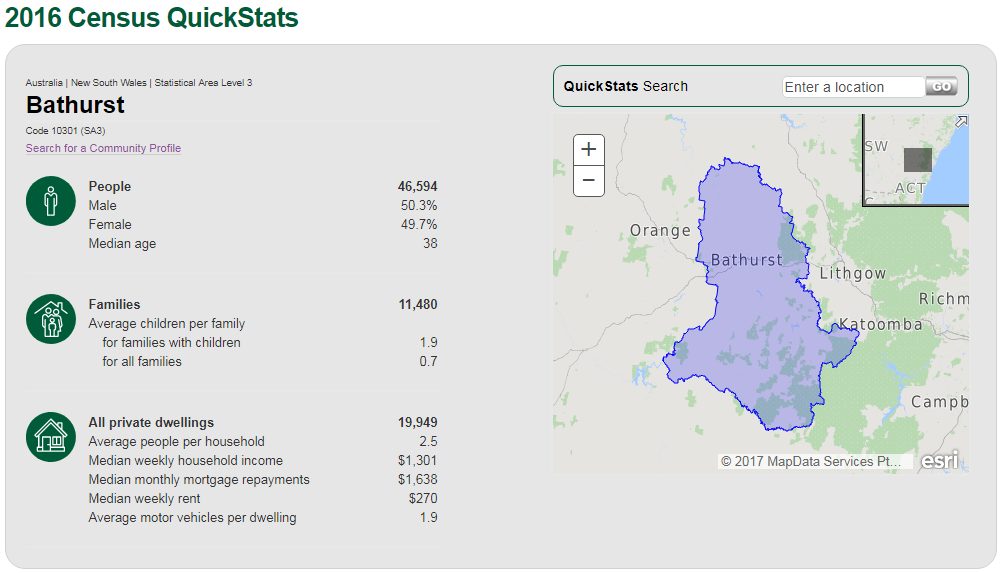
AND what is even more disturbing…
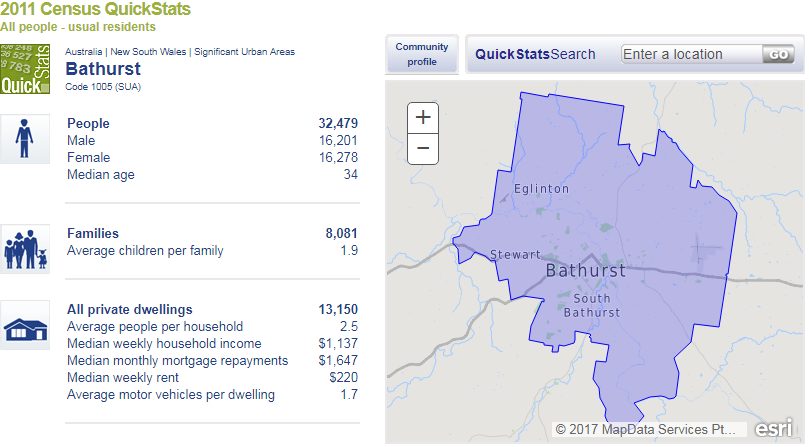
Not only have the boundaries changed but also the headings for the area on the Census data.
In 2006 the information was under the heading of Statistical District (SDIST),
In 2011 the information was under the heading of Significant Urban Area (SUA) and finally,
In 2016 the information was under the heading of Statistical Area Level 3.
Let me be very frank with you!
How the hell are new investors meant to decipher all of that AND make a proper educated decision on an area to invest in? (I’m turning into Ms Cranky-pants right now).
Excuse my French but this makes it bloody difficult to actually ascertain what is happening in an area, when the boundaries keep moving and the data collection labelling keeps changing.
You’d be right in thinking they are deliberately trying to make it difficult.
So, how do you now gather information on population for your area of interest? I would suggest making contact with the local Council as they will have information with regard to population and this should be current.
Further information can also be gathered from Profile.id under the Population Forecast tab http://profile.id.com.au/ and http://www.communityprofile.com.au/.
BTW, the one downside with these sites is that not all council areas are listed but it certainly has a large number of areas on the site.